Log from Workers
Debugging is a critical part of developing a new application — whether running code in the initial stages of development, or trying to understand an issue occurring in production.
You can access logs and exceptions for your Workers by logging into the dashboard or using wrangler tail.
The Workers platform captures all console.log’s and uncaught exceptions, in addition to information about the event itself.
Adding custom logs
Any console.log statements within your Worker will appear within wrangler tail and the dashboard output. The following example demonstrates a custom console.log within a Worker request handler.
export default {  async fetch(request) {    const { cf } = request;    const { city, country } = cf;
    console.log(`Request came from city: ${city} in country: ${country}`);
    return new Response("Hello worker!", {      headers: { "content-type": "text/plain" },    });  }
}
addEventListener("fetch", (event) => {  event.respondWith(handleRequest(event.request));
});

/** * Respond with hello worker text * @param {Request} request */
async function handleRequest(request) {  const { cf } = request;  const { city, country } = cf;
  console.log(`Request came from city: ${city} in country: ${country}`);
  return new Response("Hello worker!", {    headers: { "content-type": "text/plain" },  });
}
After you deploy the above code, run wrangler tail in your terminal, and then access your Worker. Your terminal will display:
$ npx wrangler tail --format=pretty[2021-08-18 17:06:55] [LAX] [Ok] GET https://logging-example.jkup.workers.dev/ | [Info] Request came from city: Pacifica in country: US[2021-08-18 17:06:56] [LAX] [Ok] GET https://logging-example.jkup.workers.dev/favicon.ico | [Info] Request came from city: Pacifica in country: US
Use wrangler tail
With your Workers application deployed, you may want to inspect incoming traffic. This may be useful in situations where a user is running into production issues that they cannot easily reproduce. In these instances, wrangler tail allows developers to livestream their Workers application’s logs, giving real-time insight into their application’s incoming requests.
To get started, run wrangler tail in your Workers project directory. This will log any incoming requests to your application available in your local terminal.
The output of each wrangler tail log is a structured JSON object:
{  "outcome": "ok",  "scriptName": null,  "exceptions": [],  "logs": [],  "eventTimestamp": 1590680082349,  "event": {    "request": {      "url": "https://www.bytesized.xyz/",      "method": "GET",      "headers": {},      "cf": {}    }  }
}
By piping the output to tools like jq, you can query and manipulate the requests to look for specific information:
$ npx wrangler tail | jq .event.request.url"https://www.bytesized.xyz/""https://www.bytesized.xyz/component---src-pages-index-js-a77e385e3bde5b78dbf6.js""https://www.bytesized.xyz/page-data/app-data.json"You can customize how wrangler tail works to fit your needs: refer to the wrangler tail documentation for available configuration options.
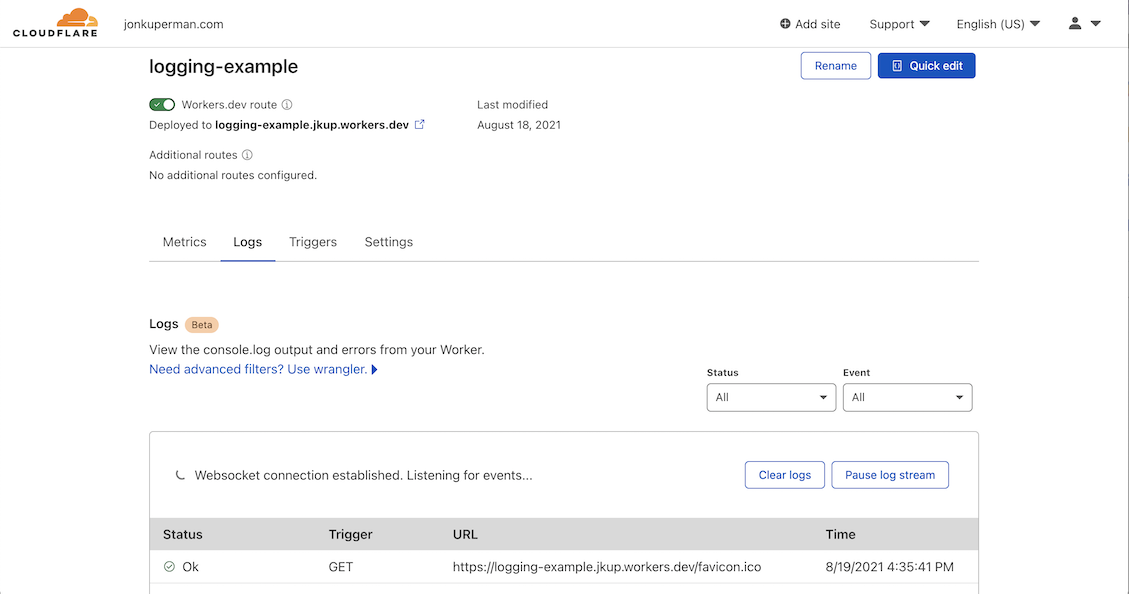
View logs from the dashboard
Review the production logs associated with any Worker:
- Log in to the Cloudflare dashboard and select your account.
- In Account Home, go to Workers & Pages.
- In Overview, select your Worker > and select Logs.
Logging is available for all customers, including those on the free plan.
Note that:
- Workers logs are not stored. You can start and stop the stream at any time to view them, but they do not persist.
- Logs will not display if the Worker’s requests per second are over 200 for the last 5 minutes.
- Logs from any Durable Objects your Worker is using will show up in the dashboard.
- A maximum of 10 clients can view a Worker’s logs at one time. This can be a combination of either dashboard sessions or
wrangler tailcalls.
Push logs to storage
Workers Logpush allows you to send Workers Trace Event Logs to a supported destination. Worker’s Trace Events Logpush includes metadata about requests and responses, unstructured console.log() messages and any uncaught exceptions.
Refer to the Workers Logpush documentation to learn how to create and configure Logpush jobs.
Related resources
- Errors and exceptions - Review common Workers errors.
- Logpush - Learn how to push Workers Trace Event Logs to supported destinations.